tldr; first steps in setting up an Openlayers map with markers loaded from a GeoJSON file
I spent a chunk of this weekend wrestling with writing software. Which was a good way to relax after a late night dancing at Is that all there is to a Disco? Saturday was a slow day: writing code, watching Escape Plan 2 with Rosy Carrick (not a good film) and getting to grips with Openlayers.
Most of the time I learn about programming through toying with examples. While this is easy in a subject I know well, it can prove more difficult in new areas. Working with Javascript libraries can be particularly difficult since it’s hard to tell which versions particular examples are for – with Openlayers there are several mutually incompatible versions with very different APIs. They say you should only do one new thing at a time, and learning Openlayers was held back by my poor Javascript skills. I also needed to get to grips with the particular way the mapping geometries worked.
But I managed to beat it all into submission and produce a working demo. I wanted to load some data from GeoJSON and display location markers on an Openstreetmap map. It’s not very much, but it is something I can later add to a larger project.
Introduction
According to Wikipedia , Openlayers is “an open source JavaScript library for displaying map data in web browsers as slippy maps”. It supports multiple map vendors and different data formats. The main project site says that version 5.2 is the latest. There are links on the site to
Basic Example
The quickstart page shows how to set up a simple Openlayers map. CSS and HTML are used to create a page-wide div that can hold the map. The Javascript to create and display the map is simple:
var map = new ol.Map({
target: 'map',
layers: [
new ol.layer.Tile({
source: new ol.source.OSM()
})
],
view: new ol.View({
center: ol.proj.fromLonLat([37.41, 8.82]),
zoom: 4
})
});
This creates a map object and sets it into the map object. A single layer is set up with OSM (openstreetmap) as the source. The view allows the map’s centre, resolution and rotation to be set. Note that zoom level 0 is zoomed out fully.
- As the tutorial explains:
A layer is a visual representation of data from a source. OpenLayers has four basic types of layers:
Tile – Renders sources that provide tiled images in grids that are organized by zoom levels for specific resolutions.
- Image – Renders sources that provide map images at arbitrary extents and resolutions.
- Vector – Renders vector data client-side.
- VectorTile – Renders data that is provided as vector tiles.
The center of the view is set using a conversion from longitude and latitude. This is one of the confusions with open streetmap. It uses a co-ordinate system called Spherical Mercator projection (known as EPSG:3857), and the usual longitude/latitude co-ordinates are held in a projection called EPSG:4326.
Adding Markers
The next stage was finding a way to add markers to the map. A lot of the examples for this were using different versions of Openlayers. The one that I ended up adapting was a recent tutorial on mediarealm.
This piece of code gave me enough of a clue to be able to set up a layer with a marker:
function add_map_point(lat, lng) {
var vectorLayer = new ol.layer.Vector({
source:new ol.source.Vector({
features: [new ol.Feature({
geometry: new ol.geom.Point(ol.proj.transform([parseFloat(lng), parseFloat(lat)], 'EPSG:4326', 'EPSG:3857')),
})]
}),
style: new ol.style.Style({
image: new ol.style.Icon({
anchor: [0.5, 0.5],
anchorXUnits: "fraction",
anchorYUnits: "fraction",
src: "https://upload.wikimedia.org/wikipedia/commons/e/ec/RedDot.svg"
})
})
});
map.addLayer(vectorLayer);
}
We create a new vectorlayer which contains another vector with all of the features. This could then display markers with a small red dot.
GeoJSON
Ultimately, I wanted to use some GeoJSON to provide a set of features. This proved to be tricky, as I had features in longitude/latitude co-ordinates, and couldn’t see how to make the import with that taken into account. Fortunately, it’s easy to iterate over objects in javascript, and I simply looped over the GeoJSON, making the conversion with one object at a time before adding it to the layer.
var featureArray;
for (feature of placedata){
        featureArray.push(new ol.Feature({
 geometry: new ol.geom.Point(ol.proj.transform([parseFloat(feature. longitude), parseFloat(feature.latitude)], 'EPSG:4326', 'EPSG:3857')),
name: feature.name,
description:feature.description
 }))
}
Once loaded, this feature array can then be dropped easily into a vector layer and added to the map. The source of the placedata array can be changed – I started out with a hardcoded version, and then added in one from a REST endpoint. I created a quick REST server using the Spring Boot REST example as a basis, and changing it to return place data.
Loading the data from GeoJSON turned out to be the fiddliest part of this because of the conversions between different projections.
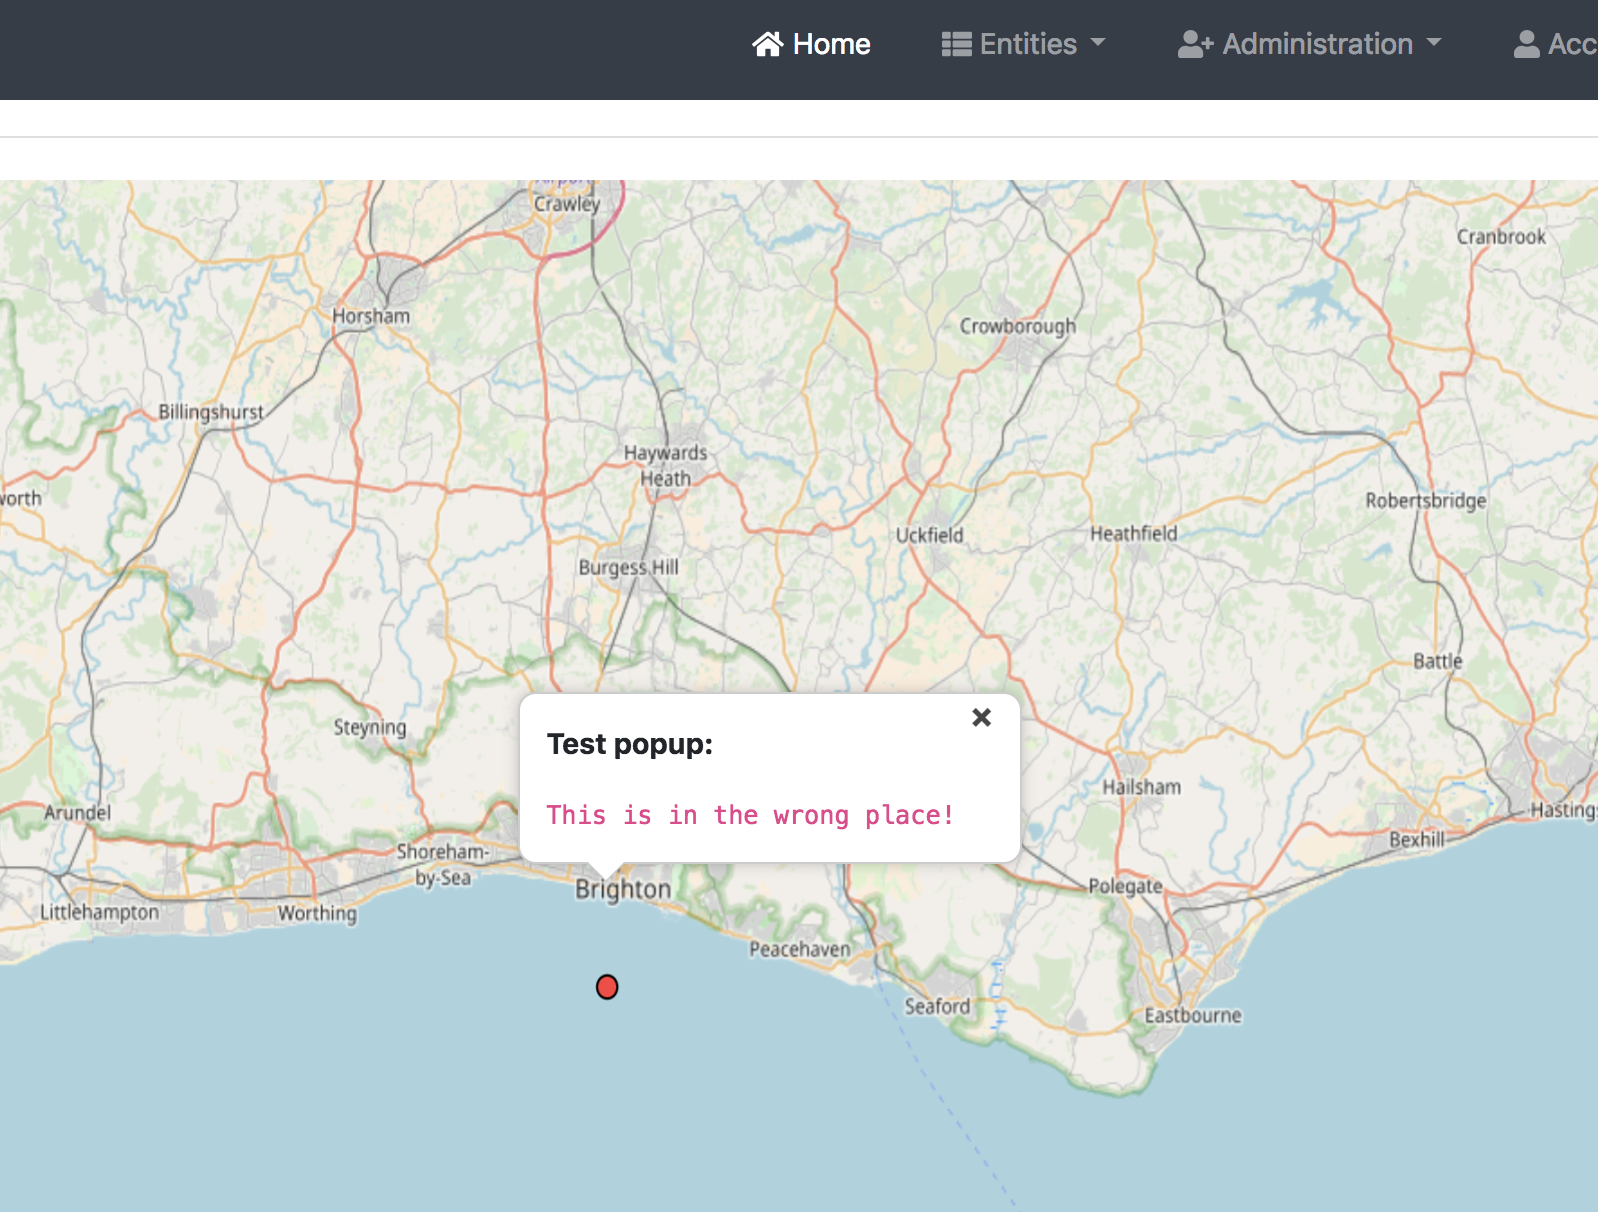
Pop-ups
The last thing I wanted to do was add pop-ups to the markers. There was an example of this in the Openlayers workshop. The way this works is simple – an onClick event for the map is added, checking whether there is a feature at the point in question. There’s a lot of code to the example, but it was easy enough to amend and get working.
Summary
It took a little longer than planned, but I managed to set up a simple HTML page that displayed openstreetmaps tiles, with markers provided by a REST endpoint.