Back in 2015, I wrote a blog post about finding ley-lines with postgis, based on some work by Steven Kay.
I described the outline of how to produce as leylines as a How-to-Draw-An-Owl tutorial, since I skipped over a lot of the complex points. I was setting up my temporary postgis instances on AWS and there was a certain amount of faff involved in sorting out database access and structure. This post is an improvement on those methods.
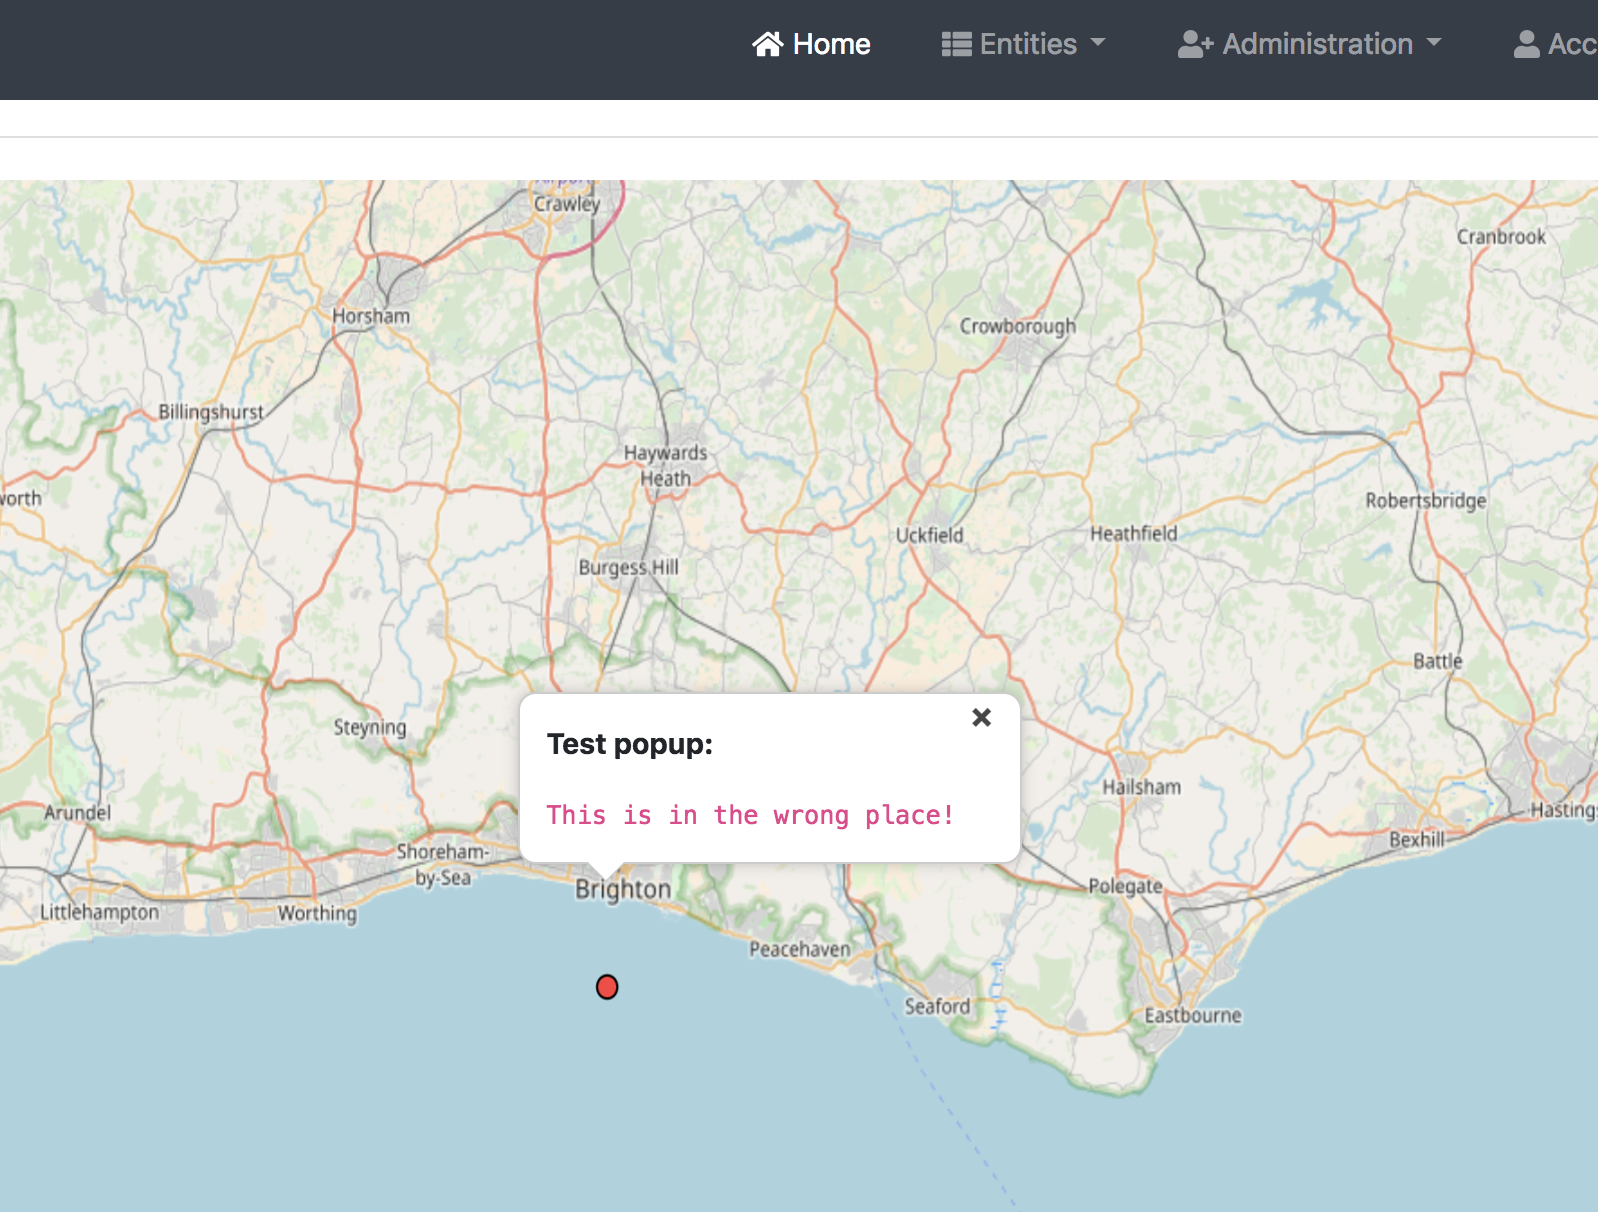
(There are still bits I’m not explaining in full – basically, how to display the ley line – but if you need more details, please let a comment and I’ll get in touch. But, basically, you need a little bit of HTML/Javascript to take this all the way through)
I’ve returned to this project for some recent writing, and the technical aspects are much easier using docker. In fact, the process can be broken down to seven steps, which I’ve listed below. You’ll need to be comfortable with a command line, have docker installed, and be willing to play about a little. But the process is relatively straightforward:
- Start up a postgis instance from a computer with docker installed:
docker run --name some-postgis -e POSTGRES_PASSWORD=mysecret -d postgis/postgis
2. Open a terminal in the docker instance:
docker exec -it some-postgis /bin/bash
3. From inside the docker instance, install the OSM tools
apt update
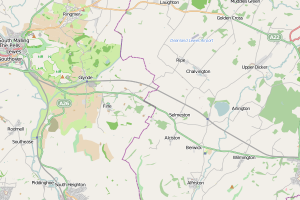
apt install osm2pgsql4. From the host computer, download some OSM data and copy the file into the container. There are various options for downloading this data but I tend to use the Geofabrik server.
docker cp ~/east-sussex-latest.osm.pbf some-postgis:postgres
Inside the container, the OSM file can then be loaded into postGIS using the command
osm2pgsql merseyside-latest.osm.pbf -U postgres
5. Back to our terminal inside the host, start up postgres
psql -U postgres
6. Now, here is the bit where I send you to another tutorial to get the ley lines SQL. These have been made available as a github gist by Steven Kay. Cutting and pasting the commands will get a fairly decent result, but I recommend having a play to get the best results.
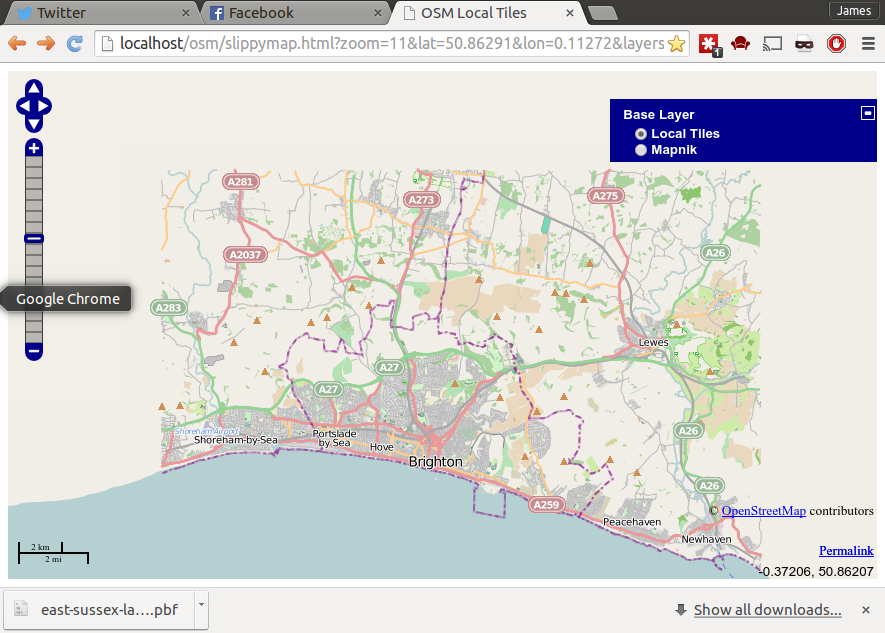
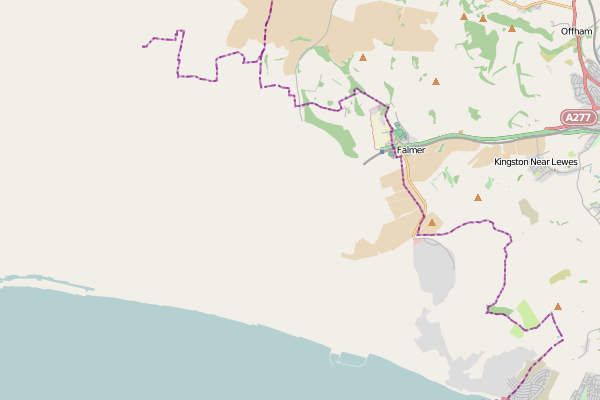
7. You can now use another query to get the KML (Keyhole Markup Representation) format of the lines. This format is fairly portable, and I tend to plonk it in a simple HTML page. The larger the “ct” value, the more items are connected by the ley.
SELECT (ST_AsKML(geom)) as geom from leys where ct = 7;
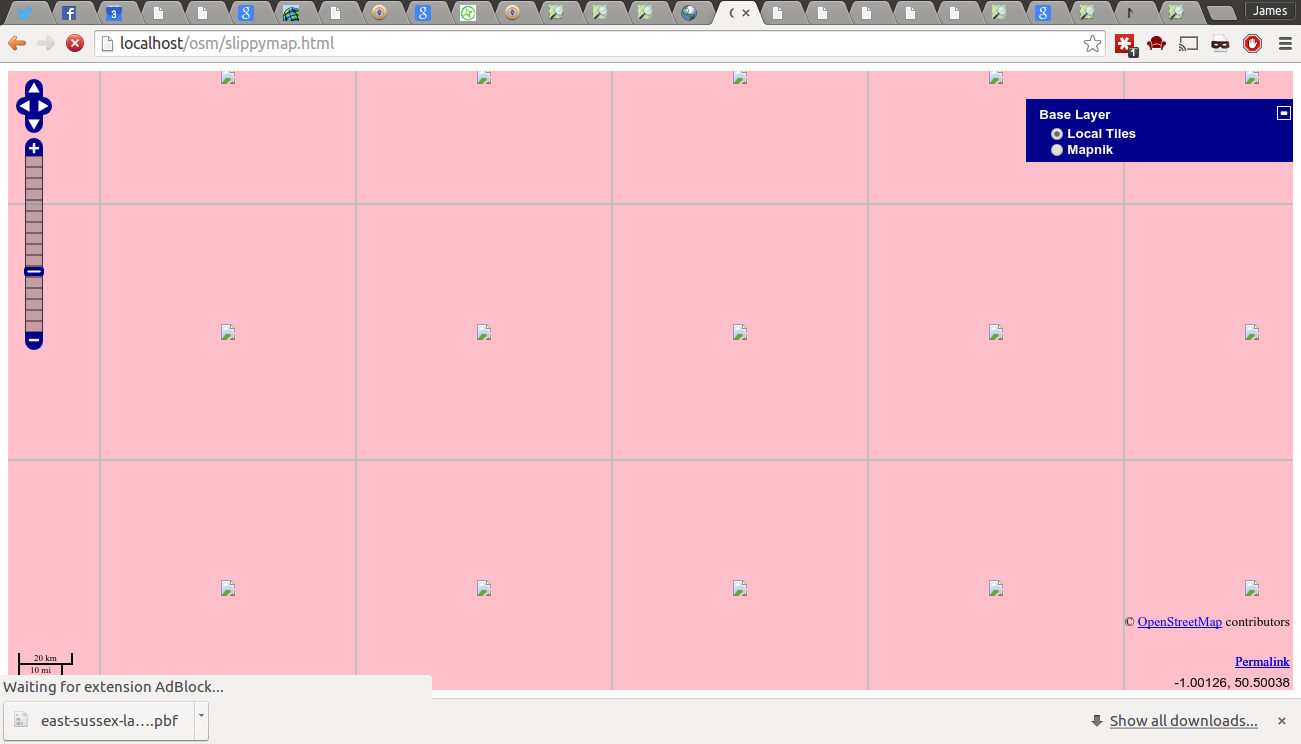
8. And this is the hand-waving step, which is to display your KML lines on an actual map. Basically, you need to amend a simple OpenLayers example. Basically, if that leaves you stuck, leave a comment and I’ll get back to you (commenter email addresses are not be visible on the actual site).
The script from Steven Kay is great for producing candidate lines. The only problem is that it tends to follow clusters of pubs on the same street. The restriction that the lines must begin and end at a site while being at least 20km long prevents short local lines being plotted. But it would also be good to add an extra predicate to judge lines by how spaced-out the locations are. That’s something I need to work on in future.